Shop
 Grade workbooks


Classroom · Math · CCSS 1.MD.C.4, 2.MD.D.10, 3.MD.B.3
worksheets for 1st to 3rd grade
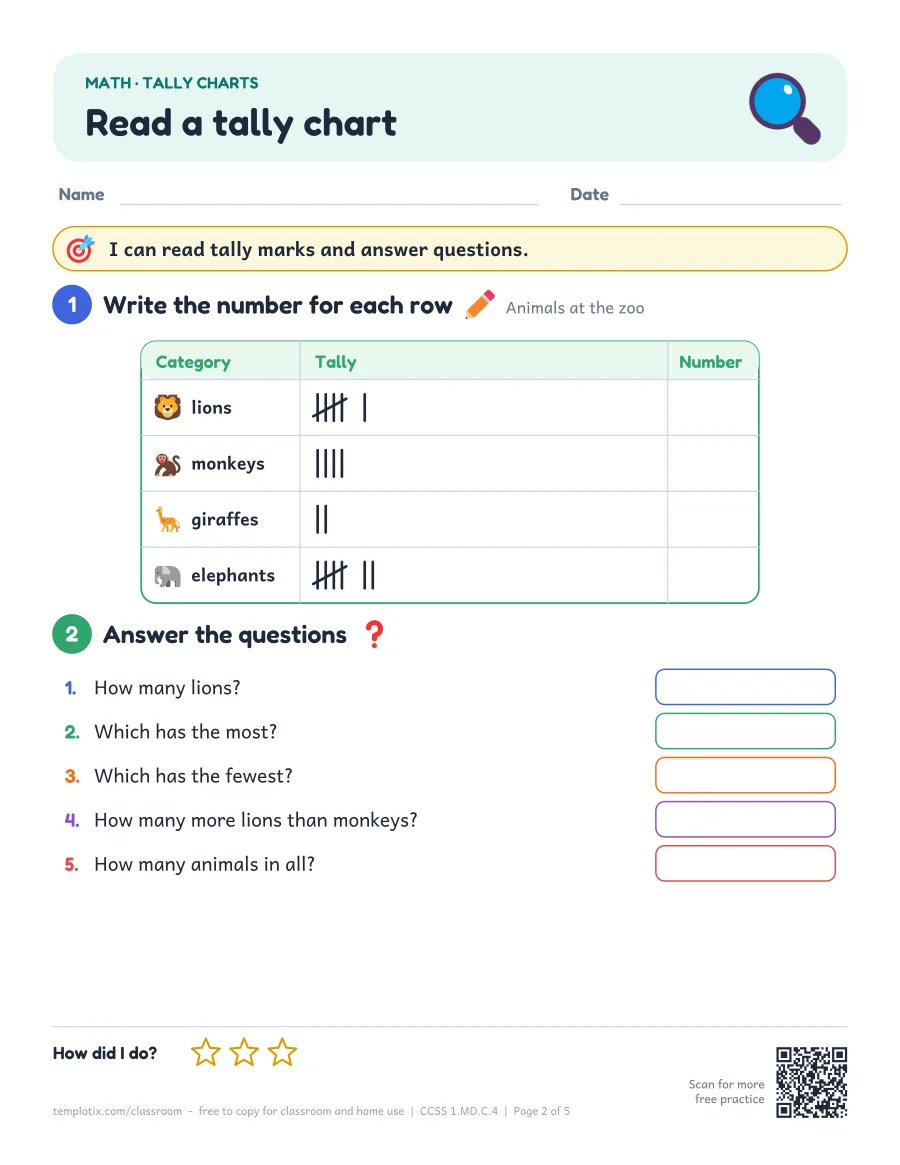
Count, sort and show data. Children make tally charts, read and draw picture graphs and bar graphs, and move on to graphs with a scale, then answer how many, how many more and how many in all.
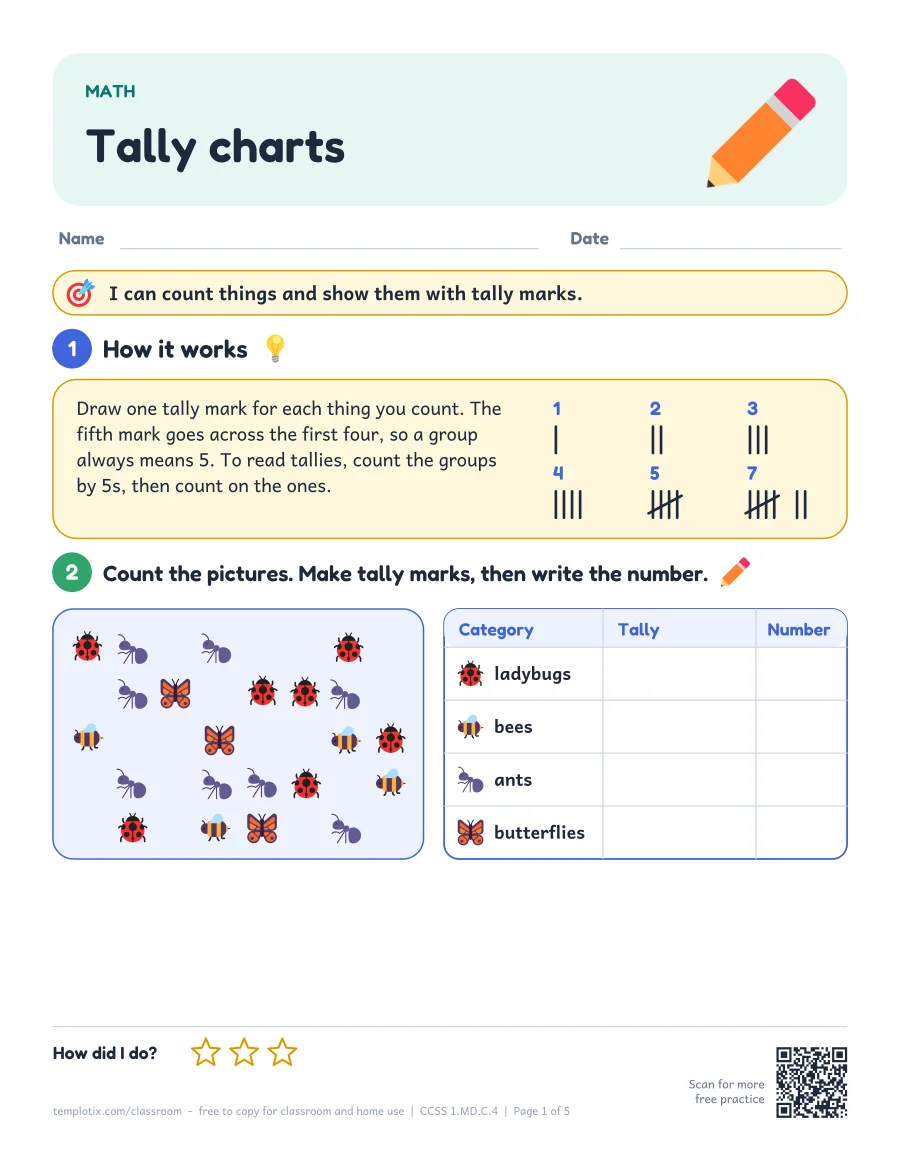
- Tally charts1st grade
Draw one tally mark for each thing you count. The fifth mark goes across the first four, so a group always means 5. To read tallies, count the groups by 5s, then count on the ones.
- Picture graphs1st and 2nd grade
A picture graph uses one picture for each thing. Line the pictures up from the same starting place, so you can see which row is longest. Count the pictures in a row to find how many.
- Bar graphs2nd grade
In a bar graph, each bar shows a number. Find the top of a bar, then look across to the number on the side. A taller bar means more. Color from the bottom line up to the number.
- Scaled picture and bar graphs3rd grade
In a scaled graph, one picture or one step stands for more than one. Read the key first. If each picture is 2 votes, count the pictures by 2s. If the scale goes up by 5, count the lines by 5s.




Make your own graph
 Make your own graph
A blank tally chart, bar graph and picture graph for a class survey.
Whole unit in one PDF Plus
 Whole unit in one PDF
All graphs and data packs, the unit chart and a contents page: 22 pages, ready to print. For Templotix Plus members.
What is in each pack
- 1. Learn itA worked example, then counting and tallying or reading a first graph.
- 2. Make a graphTurn a tally chart into a picture graph or a bar graph, or read a tally chart.
- 3. Read and compareMost, fewest, how many more and how many in all.
- 4. Word problemsFour short stories about votes, pets, weather and books.
- 5. Answer key and tipEvery answer on one page, plus a teaching tip for grown-ups.


How to teach graphs and data
- Ask a real question. Take a class vote, such as a favorite fruit or how everyone gets to school. Real data from the class keeps children interested.
- Tally as you go. Make one mark for each answer, and cross every fifth mark to make a group of five.
- Show it as a graph. Draw one picture or color one box for each mark. Check that every row or bar starts at the same line.
- Talk about it. Ask which has the most, which has the fewest, how many more and how many in all.
More math
- Telling time
- Money
- Fractions
- Division
- Multi-digit multiplication
- Decimals
- Greater than and less than
- Skip counting
- Shapes
- Number bonds
- Measurement
- Area and Perimeter
- Rounding and Estimating
- 3-Digit Addition and Subtraction
- Factors and Multiples
- Fraction Operations
- Decimal Operations
- Math Word Problems
- Geometry
- Order of Operations
- Measurement Conversions
- Counting
- Patterns
- Multiplication Strategies
- Multi-Digit Place Value
Common questions
What graphs do children learn in 1st to 3rd grade?
In 1st grade, children sort data into up to three groups and answer questions about it, often with tally charts and picture graphs. In 2nd grade they draw picture graphs and bar graphs with up to four groups. In 3rd grade they read and draw scaled graphs, where one picture or one square stands for more than one.
How do you teach tally marks?
Draw one line for each thing you count. The fifth line crosses the first four, so each finished group shows 5. To read tallies, count the groups by fives, then count on the single lines.
What is a scaled graph?
In a scaled picture graph, each picture stands for more than one, such as 2 votes. In a scaled bar graph, the numbers on the side count by 2s, 5s or 10s. The key or the scale tells you how much each step is worth.
Can I copy these worksheets for my class?
Yes. The PDFs are free to print and photocopy for classroom and home use, in color or in the black-and-white ink saver. Please link to this page rather than re-uploading the files.