Shop
 Grade workbooks


Classroom · Graphs and data · 3rd grade

Scaled picture and bar graphs worksheets
A free five-page pack for 3rd grade: learn to read and make graphs with a scale, with a worked example, practice pages, word problems and an answer key.
How to do it
 How to do it
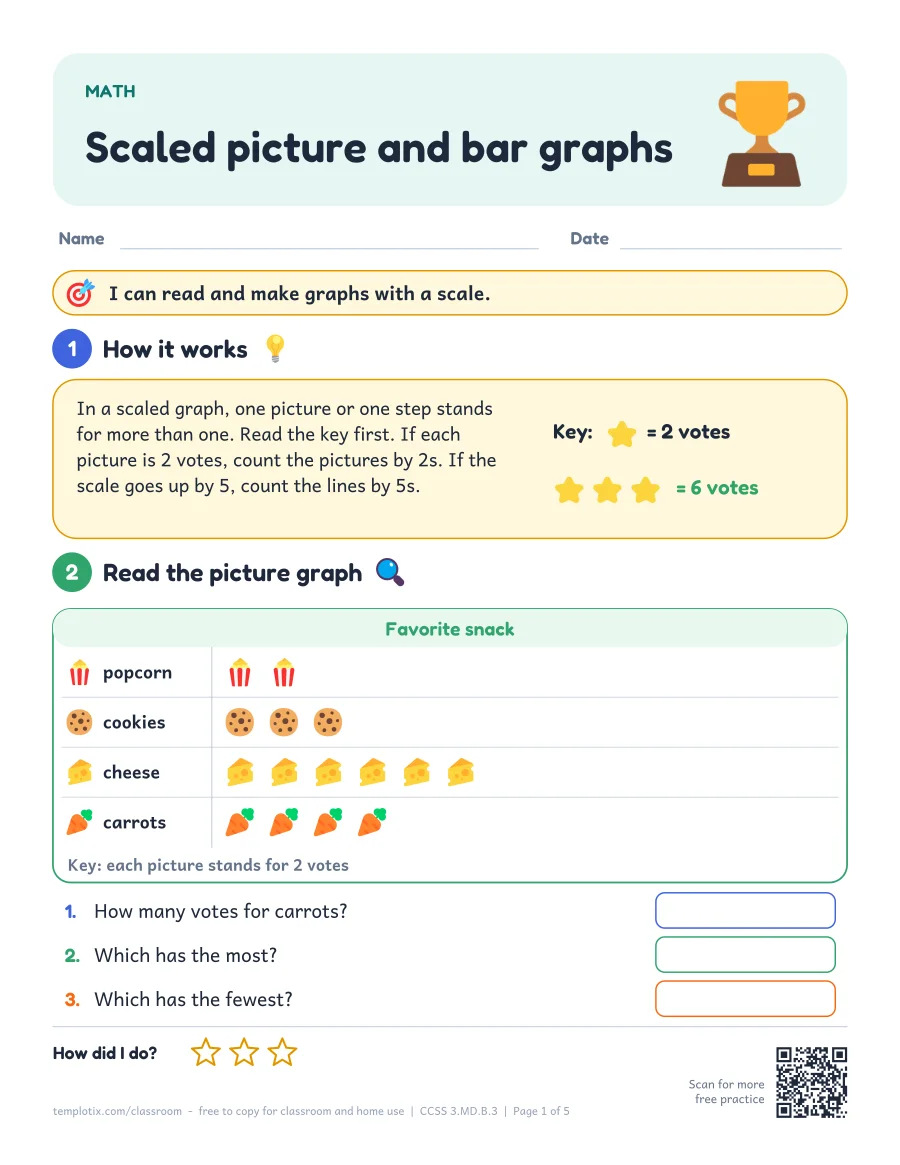
In a scaled graph, one picture or one step stands for more than one. Read the key first. If each picture is 2 votes, count the pictures by 2s. If the scale goes up by 5, count the lines by 5s.
Teaching tip
 Teaching tip
Before reading any scaled graph, ask: what does one picture or one step stand for? Children who skip the key count by ones.
Try some
Each picture = 2. How many do 3 pictures show?Tap to check6
Each picture = 2. How many do 5 pictures show?Tap to check10
Each picture = 2. How many do 7 pictures show?Tap to check14
Each picture = 2. How many do 4 pictures show?Tap to check8
Each picture = 5. How many do 2 pictures show?Tap to check10
Each picture = 5. How many do 6 pictures show?Tap to check30
Each picture = 5. How many do 3 pictures show?Tap to check15
Each picture = 5. How many do 8 pictures show?Tap to check40
Word problems
In a picture graph, each star stands for 2 votes. Soccer has 6 stars. How many votes did soccer get?Show answer

12 votes (6 × 2 = 12)
The key says each book picture stands for 5 books. Class A has 7 pictures. How many books did Class A read?Show answer

35 books (7 × 5 = 35)
A bar graph shows 35 votes for apples and 20 votes for grapes. How many more votes did apples get?Show answer

15 more votes (35 – 20 = 15)
On Aisha’s bar graph, the scale goes up by 2. A bar stops halfway between 8 and 10. What number does it show?Show answer

9
What the worksheets look like
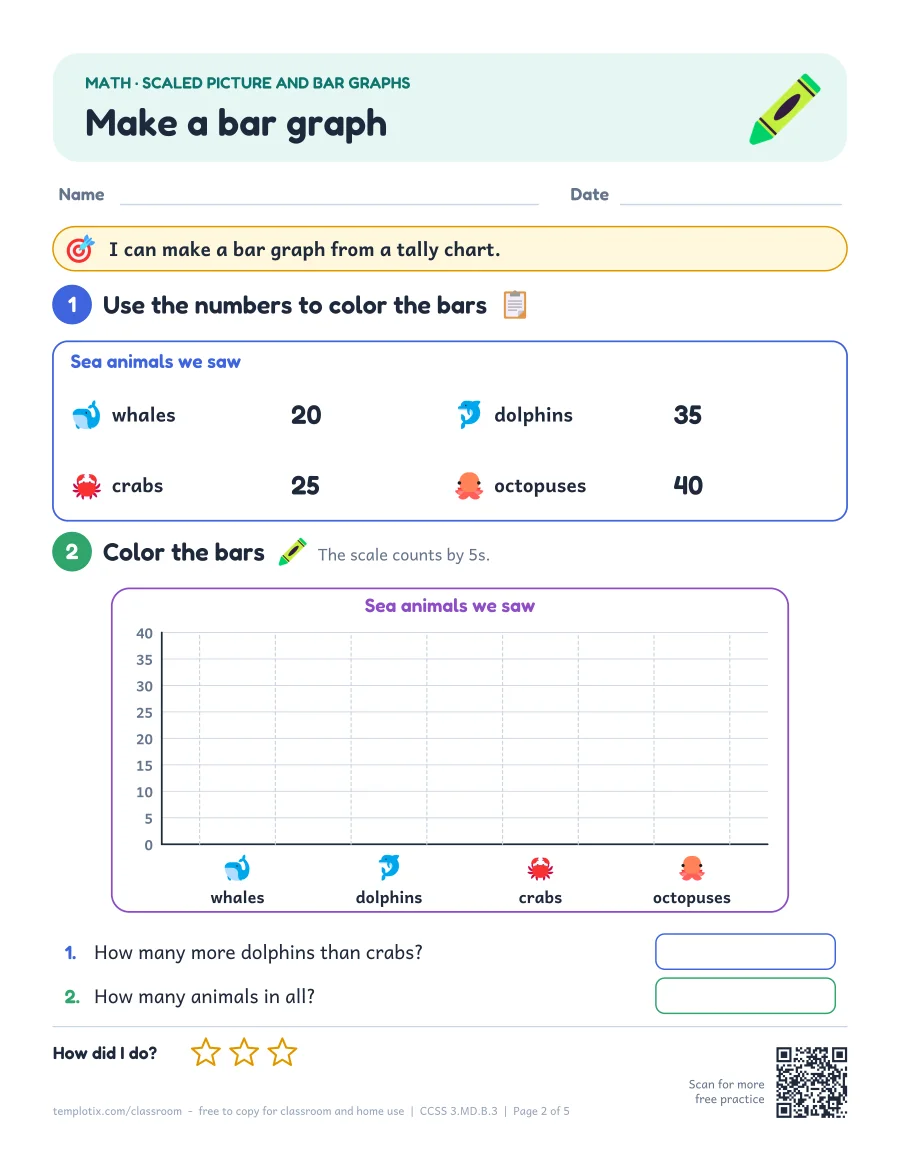
Make your own graph
 Make your own graph
A blank tally chart, bar graph and picture graph for a class survey.
Common questions
How do you teach scaled picture and bar graphs?
In a scaled graph, one picture or one step stands for more than one. Read the key first. If each picture is 2 votes, count the pictures by 2s. If the scale goes up by 5, count the lines by 5s. Before reading any scaled graph, ask: what does one picture or one step stand for? Children who skip the key count by ones.
What grade learns scaled picture and bar graphs?
Usually 3rd grade. In the Common Core it is part of 3.MD.B.3.
Is there an answer key?
Yes. Page 5 has every answer from the pack and a short teaching tip.