Shop
 Grade workbooks


Classroom · Graphs and data · 2nd grade

Bar graphs worksheets
A free five-page pack for 2nd grade: learn to read and make a bar graph, with a worked example, practice pages, word problems and an answer key.
How to do it
 How to do it
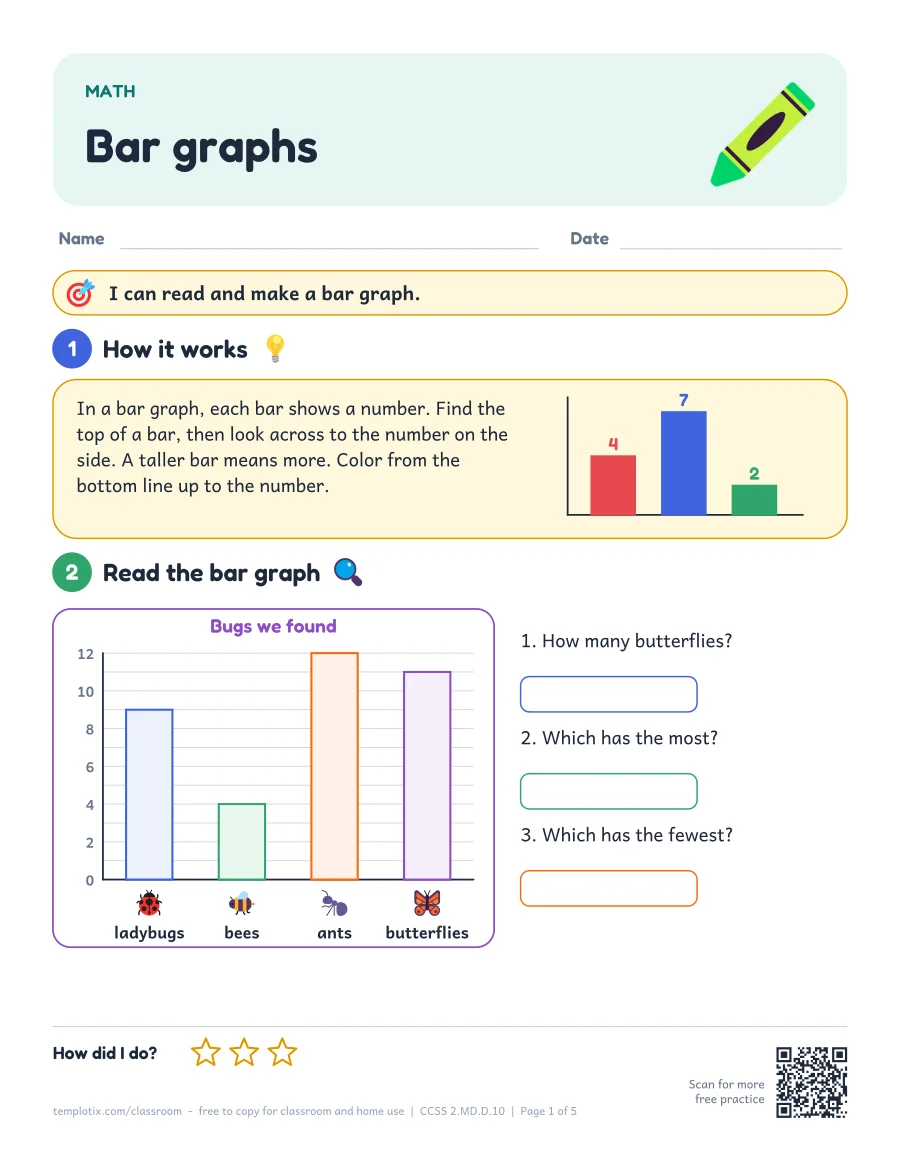
In a bar graph, each bar shows a number. Find the top of a bar, then look across to the number on the side. A taller bar means more. Color from the bottom line up to the number.
Teaching tip
 Teaching tip
Use a ruler or a strip of paper to look straight across from the top of a bar to the number scale.
Try some
Animals at the zoo (lions 8, monkeys 10, giraffes 4, elephants 5): How many lions?Tap to check8
Animals at the zoo (lions 8, monkeys 10, giraffes 4, elephants 5): Which has the most?Tap to checkmonkeys
Animals at the zoo (lions 8, monkeys 10, giraffes 4, elephants 5): Which has the fewest?Tap to checkgiraffes
Animals at the zoo (lions 8, monkeys 10, giraffes 4, elephants 5): How many more lions than elephants?Tap to check3
Animals at the zoo (lions 8, monkeys 10, giraffes 4, elephants 5): How many animals in all?Tap to check27
Word problems
The bar for apples goes up to 9. The bar for pears goes up to 6. How many more apples than pears?Show answer

3 more apples (9 – 6 = 3)
A bar graph shows that 7 children walk, 5 ride the bus and 8 come by car. How many children in all?Show answer

20 children (7 + 5 + 8 = 20)
In a bar graph, cats = 6, dogs = 9 and fish = 3. Which bar is the shortest?Show answer

Fish (3)
Sara needs a bar for 10, but colored it up to 11. What should Sara fix?Show answer
Erase the top box so the bar stops at 10.
What the worksheets look like
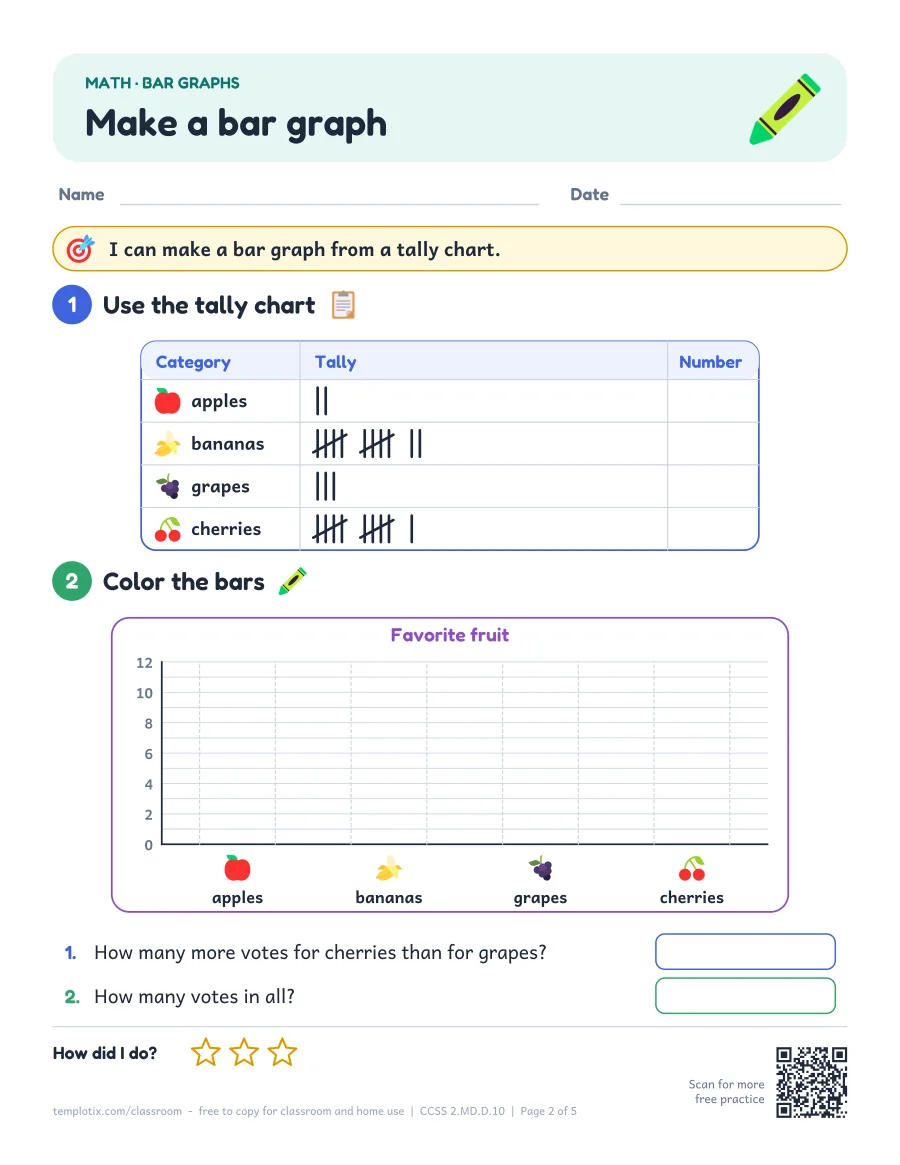
Make your own graph
 Make your own graph
A blank tally chart, bar graph and picture graph for a class survey.
Common questions
How do you teach bar graphs?
In a bar graph, each bar shows a number. Find the top of a bar, then look across to the number on the side. A taller bar means more. Color from the bottom line up to the number. Use a ruler or a strip of paper to look straight across from the top of a bar to the number scale.
What grade learns bar graphs?
Usually 2nd grade. In the Common Core it is part of 2.MD.D.10.
Is there an answer key?
Yes. Page 5 has every answer from the pack and a short teaching tip.