 Shop
 Grade workbooks


Math charts · 3rd and 4th grade

Free printable
A division chart lists the division facts for every number from 1 to 12. Each fact is a times table fact turned around: 6 × 7 = 42, so 42 ÷ 6 = 7 and 42 ÷ 7 = 6.
3 versions below · color or ink saver · CCSS 3.OA.A.2, 3.OA.C.7
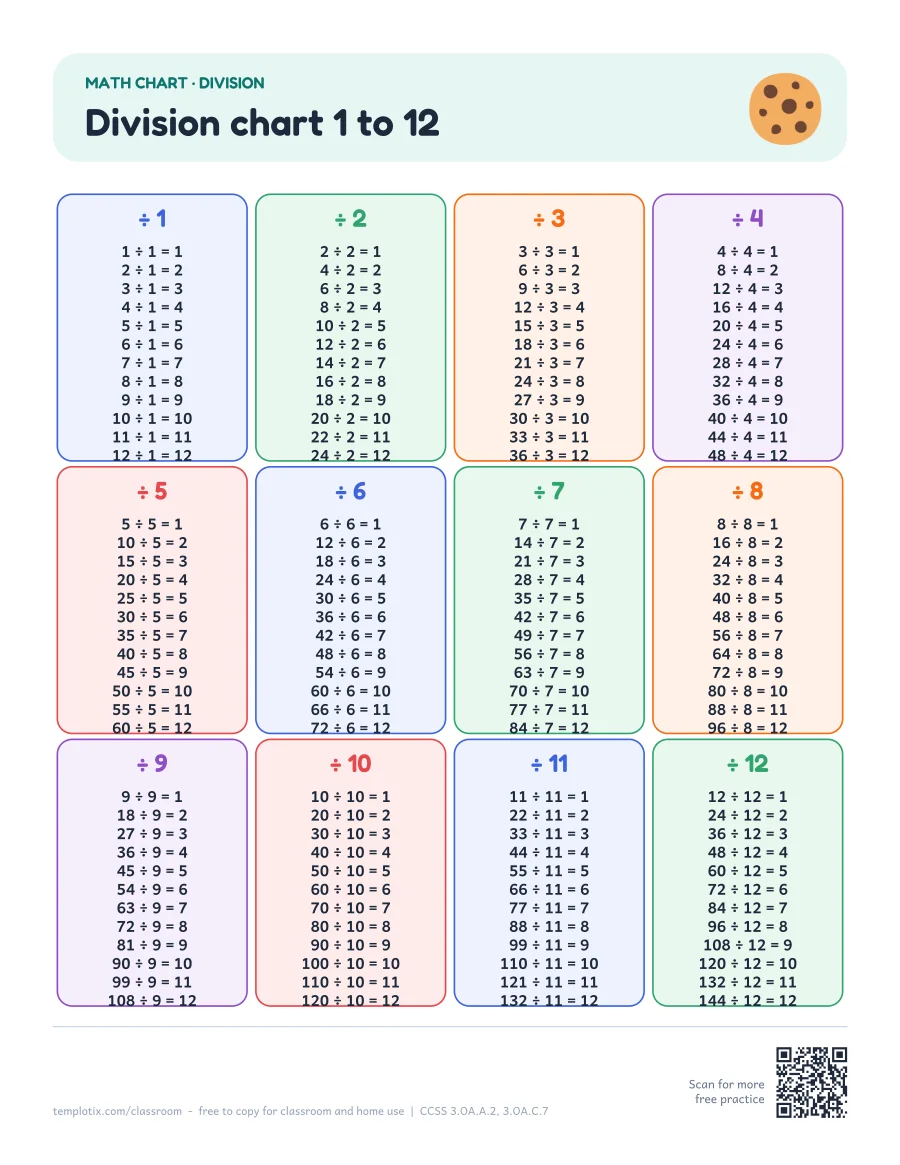
Division chart 1 to 12
All twelve division tables on one page, from ÷ 1 to ÷ 12.
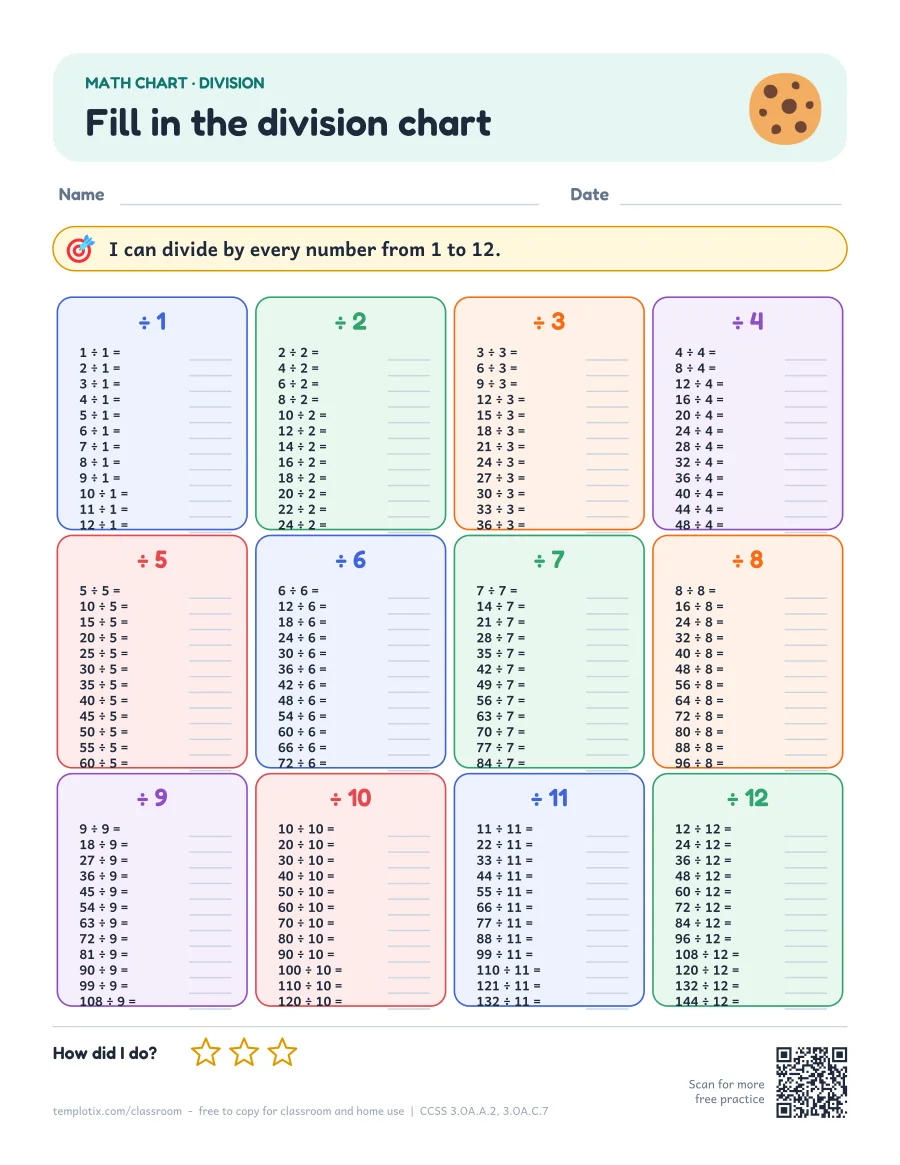
Blank division chart
The same chart with the answers left empty, to fill in and check.
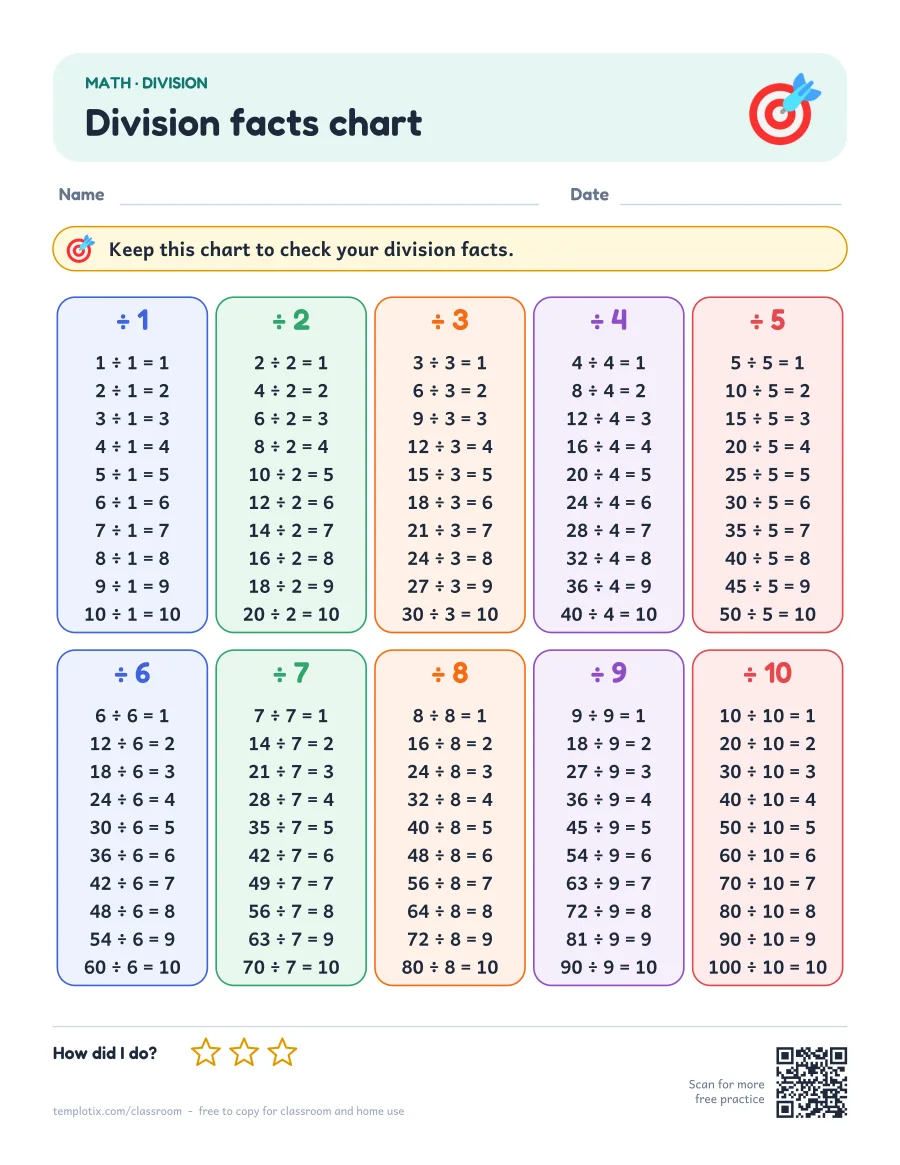
How to use a division chart
 How to use a division chart
- 1Think multiplication. For 56 ÷ 8, ask: 8 times what makes 56? The answer is 7.
- 2Learn one table at a time. Start with ÷ 2, ÷ 5 and ÷ 10, which follow the easiest times tables.
- 3Spot the pattern. Down each table, the number being divided goes up by the divisor and the answer goes up by one.
- 4Fill in the blank chart. Children complete it from memory, then check against the full chart.
More math for 3rd and 4th grade
Common questions
How do you read a division chart?
Find the box for the number you are dividing by. Each line shows a fact, for example 36 ÷ 6 = 6. The answers in each box go from 1 to 12.
How are division and multiplication related?
Division undoes multiplication. If 4 × 9 = 36, then 36 ÷ 4 = 9 and 36 ÷ 9 = 4. Knowing the times tables means knowing the division facts.
What is 72 divided by 8?
72 ÷ 8 = 9, because 8 × 9 = 72.
From the Templotix shop
Ready-to-print packs that go with this page
Bigger themed packs with answer keys and a certificate. Every free worksheet on Templotix stays free.
 K, 1st and 2nd gradeWinter Review Bundle95 pages · color and ink saver PDFs$12.99$17.97See inside
 Kindergarten · winter reviewKindergarten Winter Review30 pages · color and ink saver PDFs$5.99See inside
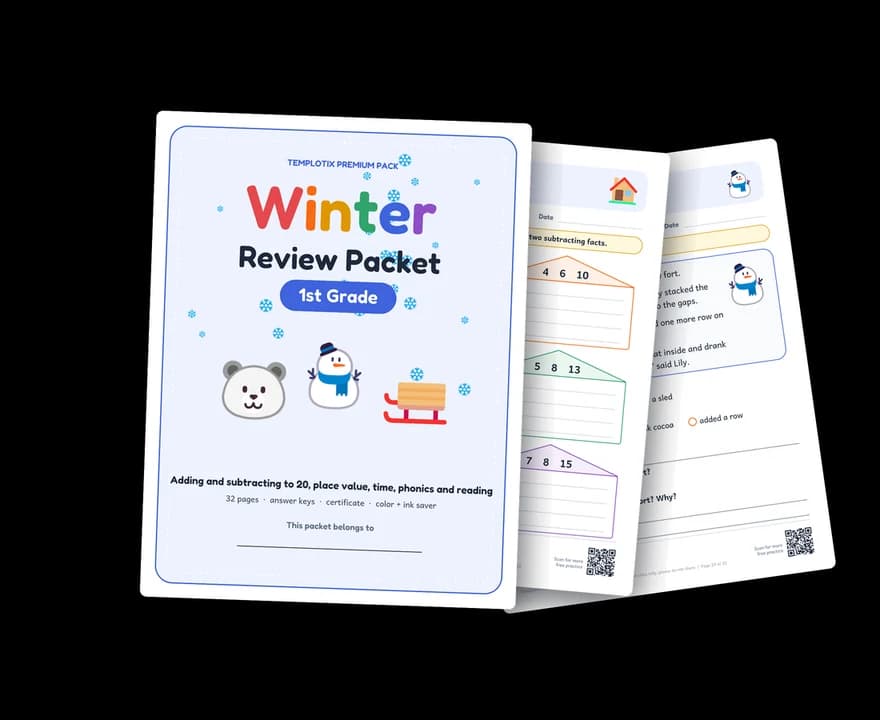 1st Grade · winter review1st Grade Winter Review32 pages · color and ink saver PDFs$5.99See inside
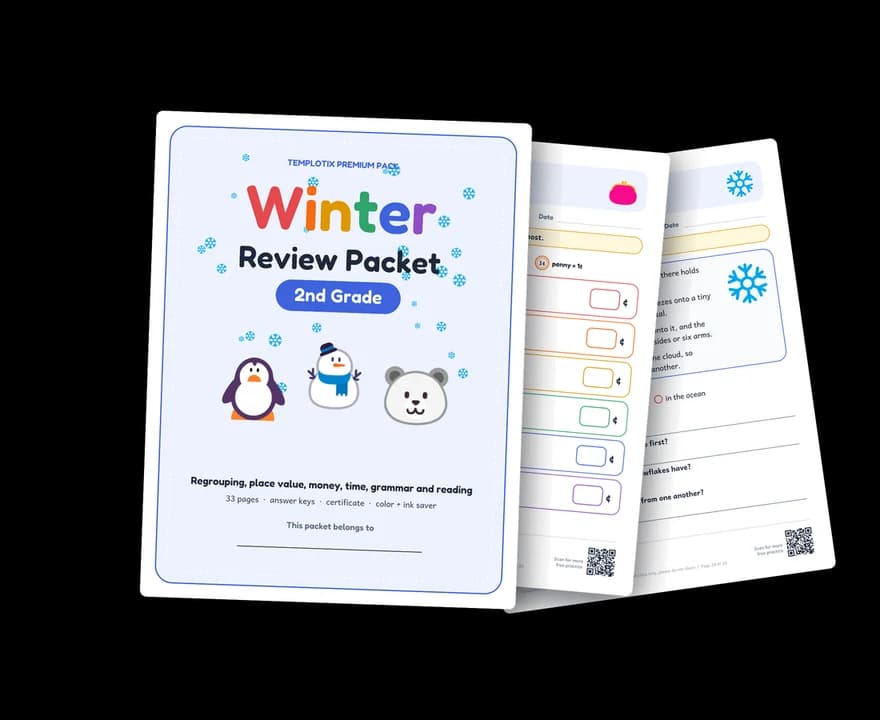 2nd Grade · winter review2nd Grade Winter Review33 pages · color and ink saver PDFs$5.99See inside