ExcelKPI Dashboards
KPI Dashboard
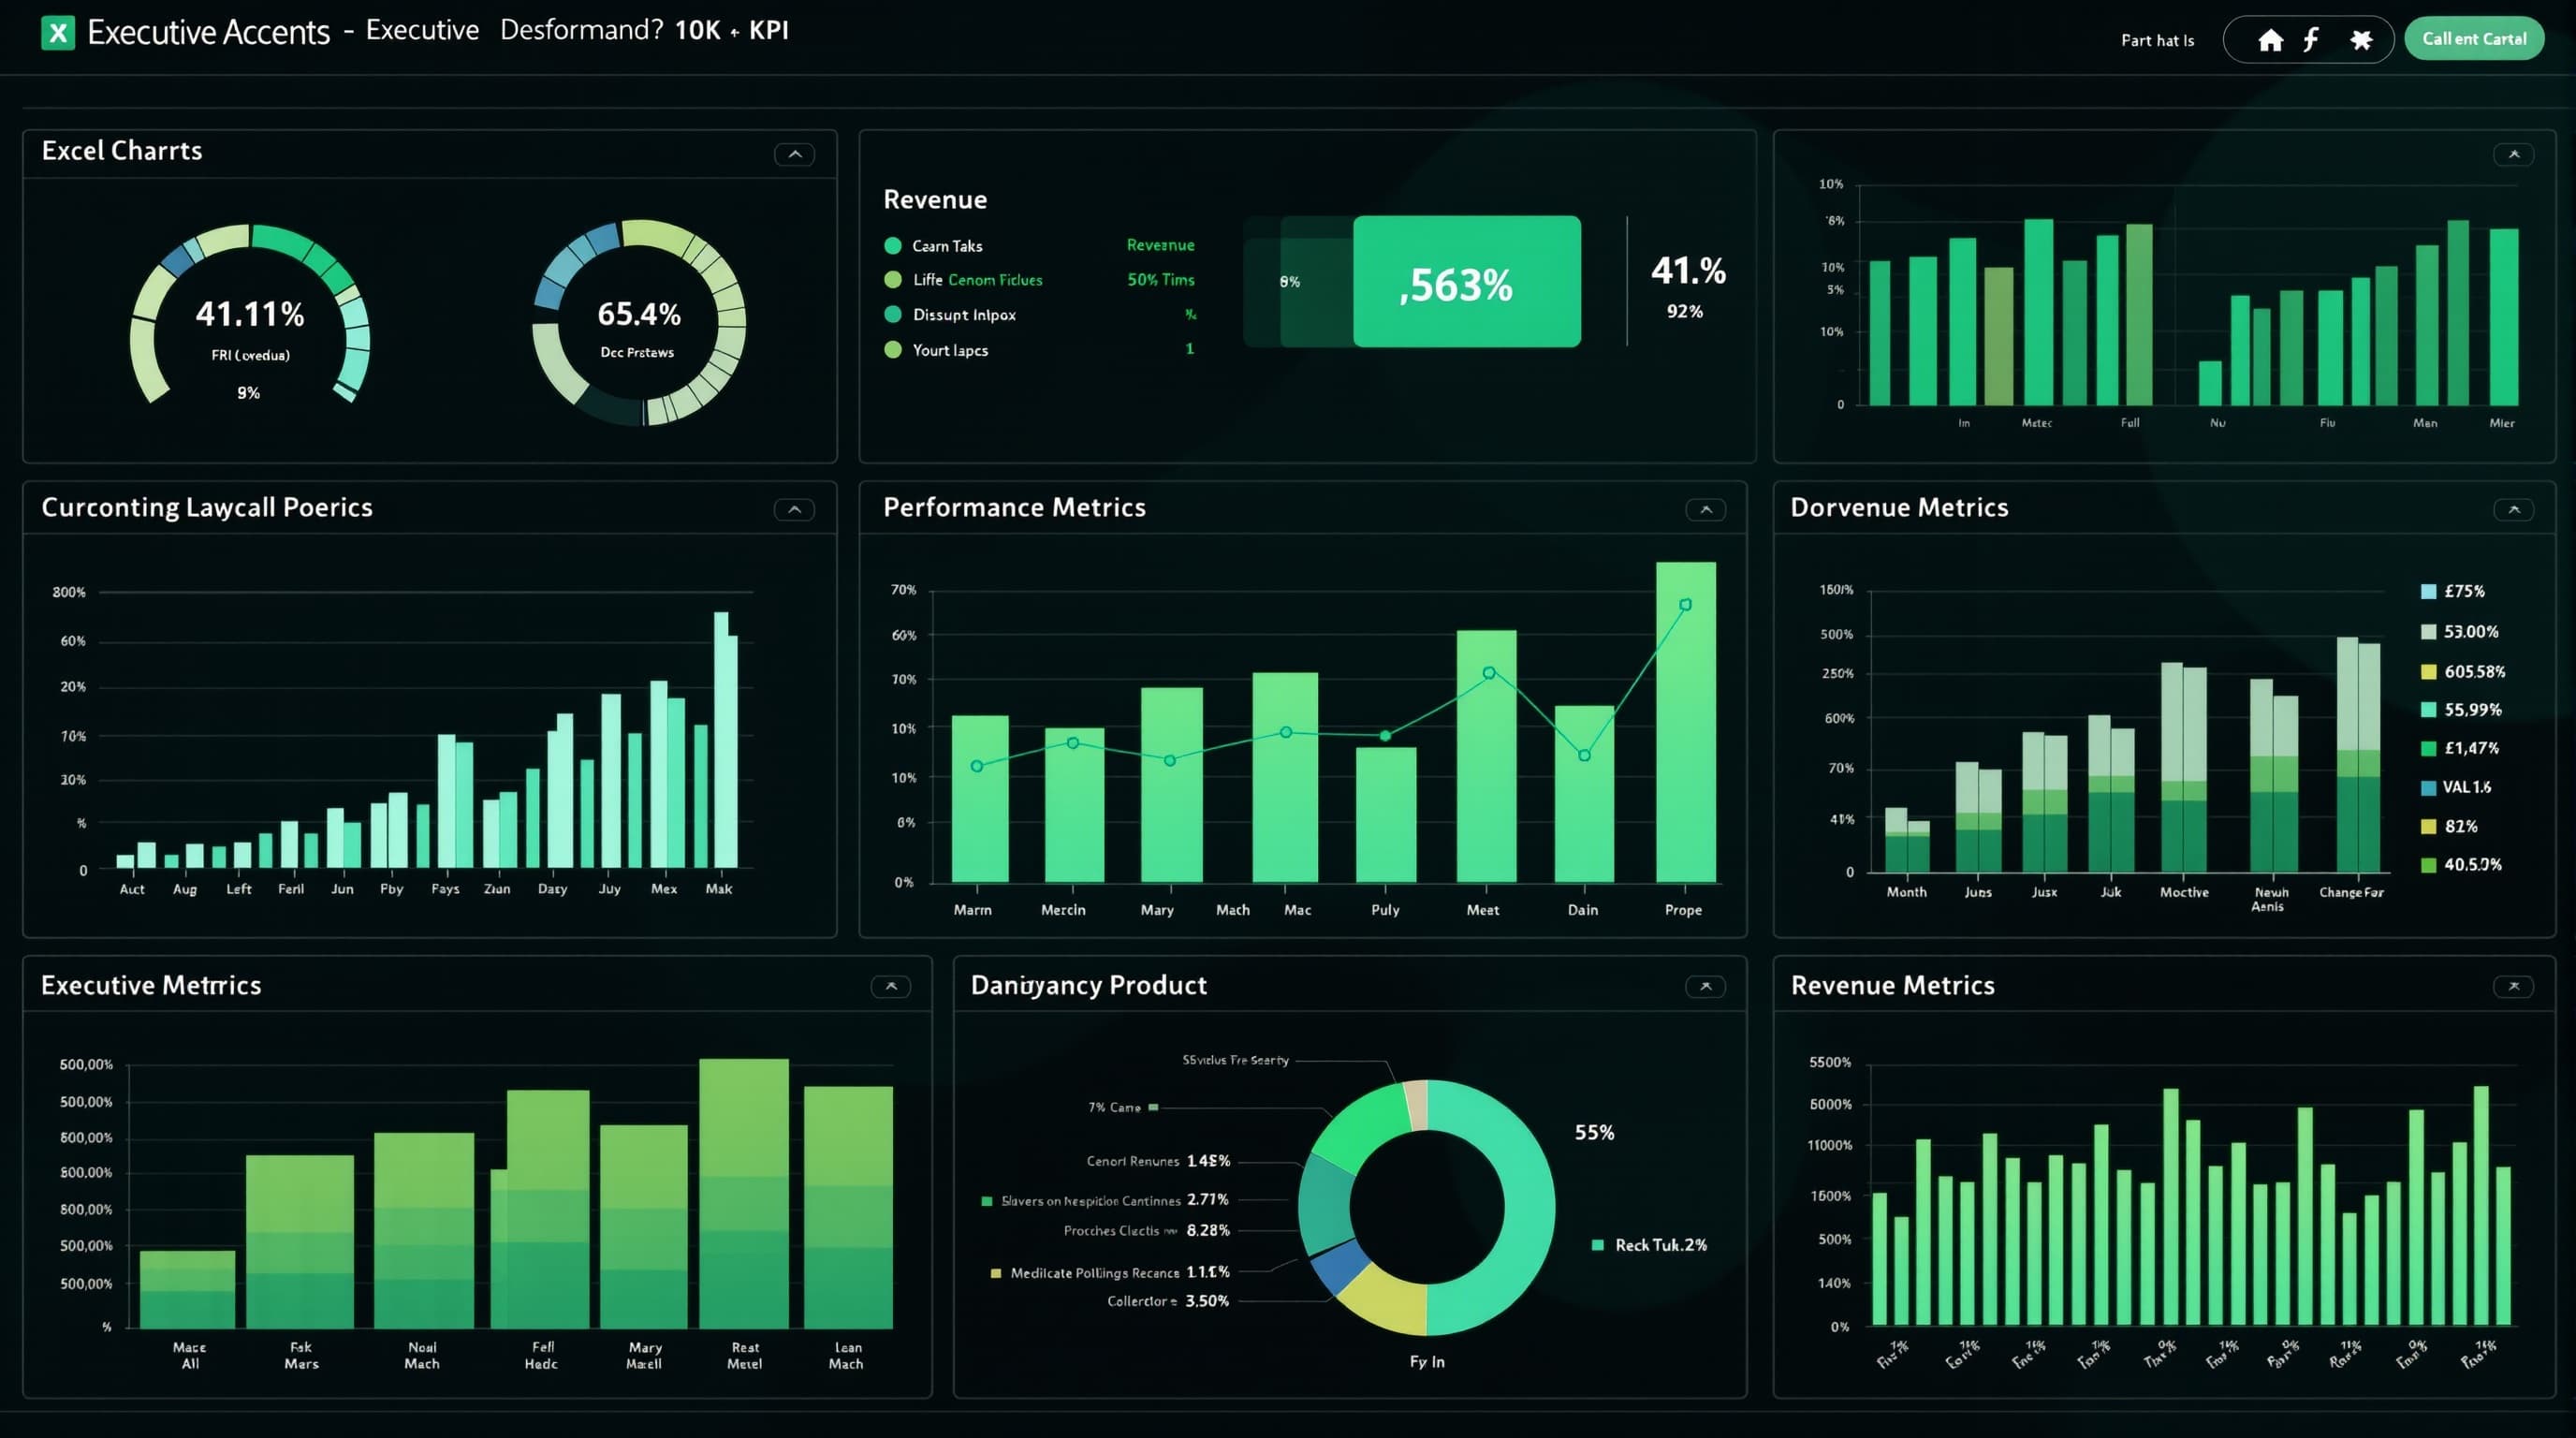
Executive dashboard with automated charts and drill-down performance views
Updated August 2026
About This Template
KPI Dashboard transforms raw business data into an executive-ready performance dashboard with automated charts and conditional formatting alerts.
Highlights
Automated charts
Conditional formatting alerts
Drill-down views
MoM and YoY comparisons
Gallery

Key Features
Summary Dashboard
One-page view with 8-12 most important KPIs and automated trend indicators.
What's Included
Executive dashboard
Automated charts
Data input templates
Reporting calendar
Pros & Cons
What We Like
- Clean dashboard design
- Thoughtful conditional formatting
- Print-ready output
What Could Be Better
- Manual data entry
- Limited to 12-15 KPIs summary
Who It's For
Business owners
Operations managers
Startup CEOs
Use Cases
SaaS CEO
Track MRR, churn, LTV, CAC in one dashboard with board-ready charts.
Frequently Asked Questions
Live data connection?
Manual entry. Power Query (2019+) can connect to databases.
Ready to transform your Excel workflow?
Get the complete KPI Dashboard system and start shipping better work today.